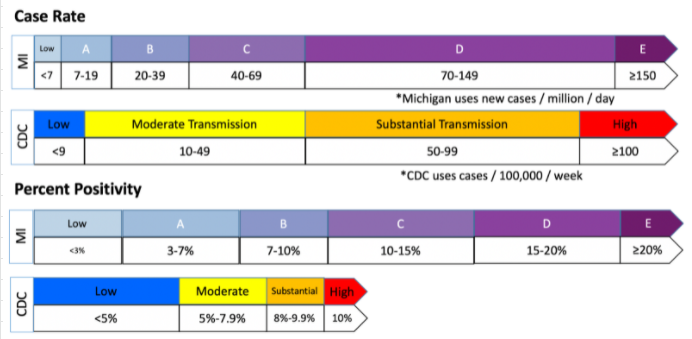
Cases
Test Positivity
Comparing new CDC school thresholds to MI levels

A calculator to translate between the CDC Transmission indicators and the MI Safe Start Map Risk Levels.
These algorithms both use the worse level of the cases indicator and the test positivity indicator to calculate the final result
